pylbm.stencil.Velocity(dim=None, num=None, vx=None, vy=None, vz=None)¶Create a velocity.
dim (int, optional) – The dimension of the velocity.
num (int, optional) – The number of the velocity in the numbering convention of Lattice-Boltzmann scheme.
vx (int, optional) – The x component of the velocity vector.
vy (int, optional) – The y component of the velocity vector.
vz (int, optional) – The z component of the velocity vector.
dim¶The dimension of the velocity.
int
num¶The number of the velocity in the numbering convention of Lattice-Boltzmann scheme.
vx¶The x component of the velocity vector.
int
vy¶The y component of the velocity vector.
int
vz¶The z component of the velocity vector.
int
v¶list
Examples
Create a velocity with the dimension and the number
>>> v = Velocity(dim = 1, num = 2)
>>> v
velocity 2
 vx: -1
Create a velocity with a direction
>>> v = Velocity(vx=1, vy=1)
>>> v
velocity 5
 vx: 1
 vy: 1
Notes
from __future__ import print_function, division
from six.moves import range
import matplotlib
import matplotlib.pyplot as plt
import matplotlib.colors as colors
import matplotlib.cm as cm
from matplotlib.patches import FancyArrowPatch
from mpl_toolkits.mplot3d import Axes3D, proj3d
import pylbm
import numpy as np
class Arrow3D(FancyArrowPatch):
def __init__(self, xs, ys, zs, *args, **kwargs):
FancyArrowPatch.__init__(self, (0,0), (0,0), *args, **kwargs)
self._verts3d = xs, ys, zs
def draw(self, renderer):
xs3d, ys3d, zs3d = self._verts3d
xs, ys, zs = proj3d.proj_transform(xs3d, ys3d, zs3d, renderer.M)
self.set_positions((xs[0],ys[0]),(xs[1],ys[1]))
FancyArrowPatch.draw(self, renderer)
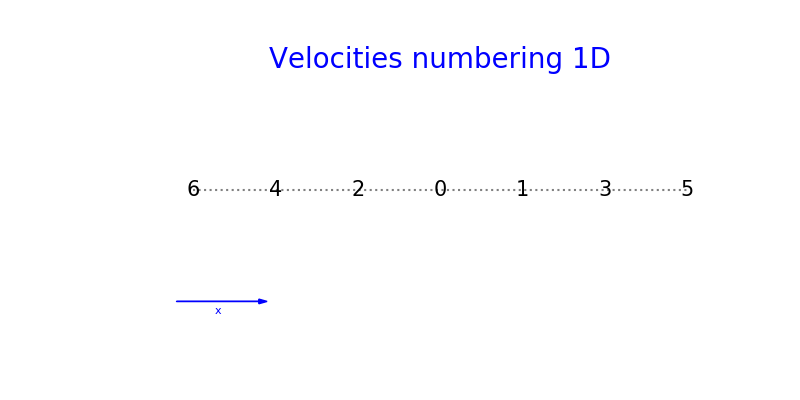
def Velocities_1D(n):
dim = 1
fig = plt.figure(dim, figsize=(8, 4), facecolor='white')
fig.clf()
xmin, xmax, ymin, ymax = 1000, -1000, -1, 1
e = 0.2
for k in range((2*n+1)**dim):
v = pylbm.stencil.Velocity(dim = dim, num = k)
x = v.vx
xmin = min(xmin, x)
xmax = max(xmax, x)
couleur_texte = 0.
couleur_trait = 0.5
plt.text(x, 0., str(v.num), color=[couleur_texte]*3,
horizontalalignment='center',verticalalignment='center',
fontsize=15)
plt.plot([xmin, xmax], [0, 0], ':', color=[couleur_trait]*3)
plt.text(0., ymax+2*e, "Velocities numbering {0:1d}D".format(dim),fontsize=20,
verticalalignment='center', horizontalalignment='center', color='b')
plt.arrow(xmin-e, ymin-e, 1, 0, head_width=0.05*dim, head_length=0.1, fc='b', ec='b')
plt.text(xmin-e+.5, ymin-1.5*e, 'x', color='b',
verticalalignment='center', horizontalalignment='center')
plt.axis('off')
plt.xlim(xmin-2*e, xmax+2*e)
plt.ylim(ymin-2*e, ymax+2*e)
plt.draw()
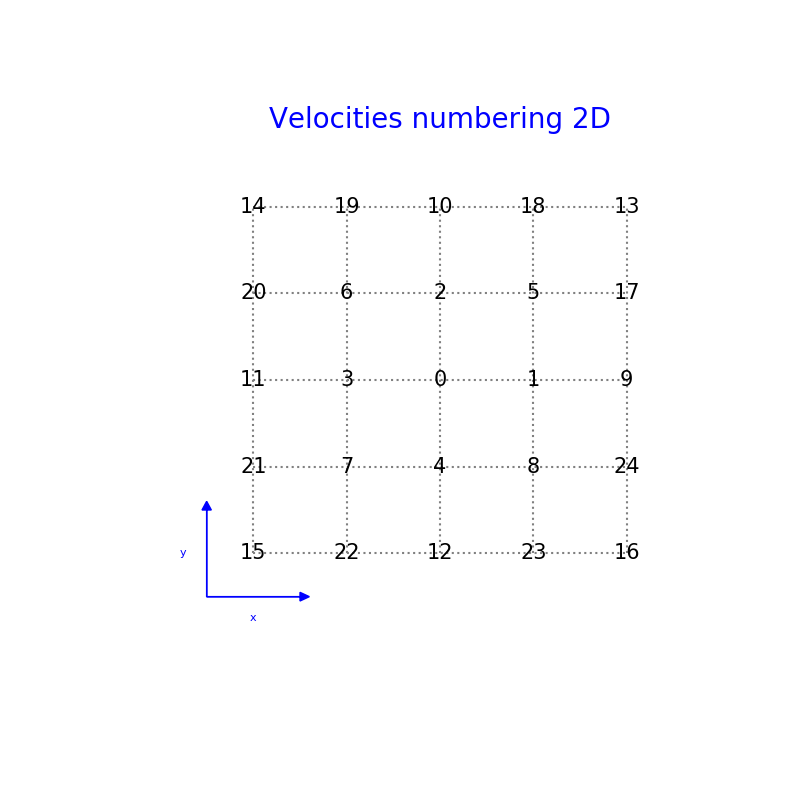
def Velocities_2D(n):
dim = 2
fig = plt.figure(dim, figsize=(8, 8), facecolor='white')
fig.clf()
xmin, xmax, ymin, ymax = 1000, -1000, 1000, -1000
e = .5
for k in range((2*n+1)**dim):
v = pylbm.stencil.Velocity(dim = dim, num = k)
x = v.vx
y = v.vy
xmin = min(xmin, x)
xmax = max(xmax, x)
ymin = min(ymin, y)
ymax = max(ymax, y)
couleur_texte = 0.
couleur_trait = 0.5
plt.text(x, y, str(v.num), color=[couleur_texte]*3,
horizontalalignment='center',verticalalignment='center',
fontsize=15)
for x in range(xmin, xmax+1):
plt.plot([x, x], [ymin, ymax], ':', color=[couleur_trait]*3)
for y in range(ymin, ymax+1):
plt.plot([xmin, xmax], [y, y], ':', color=[couleur_trait]*3)
plt.text(0., ymax+2*e, "Velocities numbering {0:1d}D".format(dim),fontsize=20,
verticalalignment='center', horizontalalignment='center', color='b')
plt.arrow(xmin-e, ymin-e, 1, 0, head_width=0.05*dim, head_length=0.1, fc='b', ec='b')
plt.arrow(xmin-e, ymin-e, 0, 1, head_width=0.05*dim, head_length=0.1, fc='b', ec='b')
plt.text(xmin-e+.5, ymin-1.5*e, 'x', color='b',
verticalalignment='center', horizontalalignment='center')
plt.text(xmin-1.5*e, ymin-e+.5, 'y', color='b',
verticalalignment='center', horizontalalignment='center')
plt.axis('off')
plt.xlim(xmin-2*e, xmax+2*e)
plt.ylim(ymin-2*e, ymax+2*e)
plt.draw()
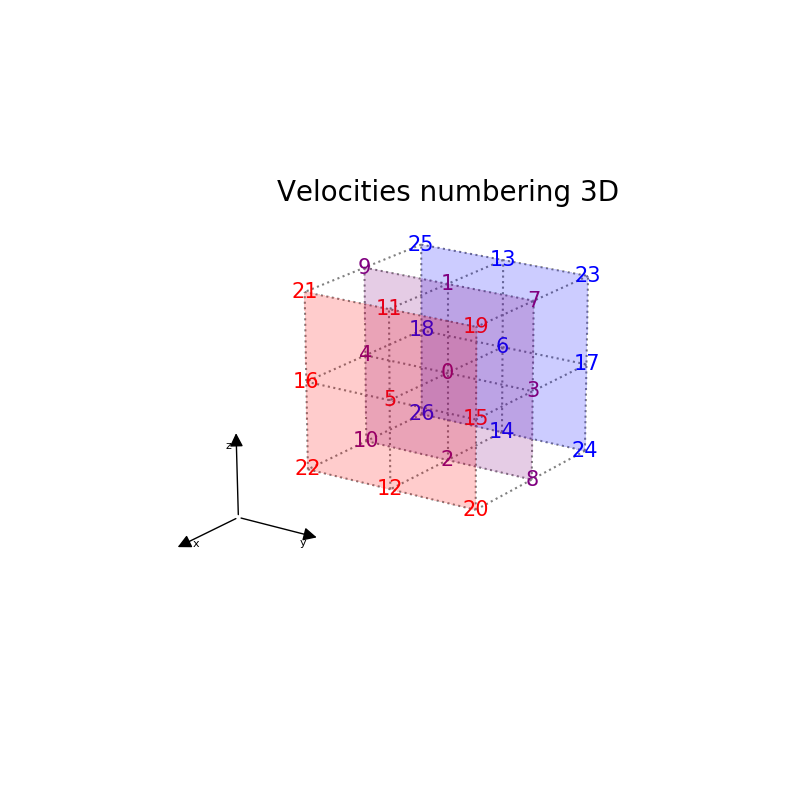
def Velocities_3D(n):
dim = 3
couleur_tour = "k"
fig = plt.figure(dim, figsize=(8, 8), facecolor='white')
fig.clf()
ax = fig.add_subplot(111, projection='3d')
xmin, xmax, ymin, ymax, zmin, zmax = 1000, -1000, 1000, -1000, 1000, -1000
e = .5
for k in range((2*n+1)**dim):
v = pylbm.stencil.Velocity(dim = dim, num = k)
x = v.vx
y = v.vy
z = v.vz
xmin = min(xmin, x)
xmax = max(xmax, x)
ymin = min(ymin, y)
ymax = max(ymax, y)
zmin = min(zmin, z)
zmax = max(zmax, z)
couleur_texte = [.5+.5*x, 0., .5-.5*x]
couleur_trait = 0.5
ax.text(x, y, z, str(v.num), color=couleur_texte,
horizontalalignment='center',verticalalignment='center',
fontsize=15)
for x in range(xmin, xmax+1):
for y in range(ymin, ymax+1):
ax.plot([x, x], [y, y], [zmin, zmax], ':', color=[couleur_trait]*3)
for x in range(xmin, xmax+1):
for z in range(zmin, zmax+1):
ax.plot([x, x], [ymin, ymax], [z, z], ':', color=[couleur_trait]*3)
for z in range(zmin, zmax+1):
for y in range(ymin, ymax+1):
ax.plot([xmin, xmax], [y, y], [z, z], ':', color=[couleur_trait]*3)
XS, YS = np.meshgrid([-1,1],[-1,1])
ZS = np.zeros(XS.shape)
couleur_plan = .8
for x in [-1,0,1]:
ax.plot_surface(ZS+x, XS, YS,
rstride=1, cstride=1, color=[.5+.5*x, 0., .5-.5*x],
shade=False, alpha=0.2,
antialiased=False, linewidth=0)
ax.text(0., 0., zmax+2*e, "Velocities numbering {0:1d}D".format(dim), fontsize=20,
verticalalignment='center', horizontalalignment='center', color=couleur_tour)
vx = Arrow3D([xmax+e,xmax+e+1],[ymin-e,ymin-e],[zmin-e,zmin-e],
mutation_scale=20, lw=1, arrowstyle="-|>", color=couleur_tour)
ax.add_artist(vx)
vy = Arrow3D([xmax+e,xmax+e],[ymin-e,ymin-e+1],[zmin-e,zmin-e],
mutation_scale=20, lw=1, arrowstyle="-|>", color=couleur_tour)
ax.add_artist(vy)
vz = Arrow3D([xmax+e,xmax+e],[ymin-e,ymin-e],[zmin-e,zmin-e+1],
mutation_scale=20, lw=1, arrowstyle="-|>", color=couleur_tour)
ax.add_artist(vz)
ax.text(xmax+e+.8, ymin-.8*e, zmin-e, 'x', color=couleur_tour,
verticalalignment='center', horizontalalignment='center')
ax.text(xmax+e, ymin-e+.8, zmin-1.2*e, 'y', color=couleur_tour,
verticalalignment='center', horizontalalignment='center')
ax.text(xmax+e, ymin-1.2*e, zmin-e+.8, 'z', color=couleur_tour,
verticalalignment='center', horizontalalignment='center')
ax.set_xlim(xmin-e, xmax+e)
ax.set_ylim(ymin-e, ymax+e)
ax.set_zlim(zmin-e, zmax+e)
ax.azim = 34
ax.elev = 20
plt.axis('off')
plt.draw()
def Velocities(dim, n):
if dim == 1:
Velocities_1D(n)
elif dim == 2:
Velocities_2D(n)
elif dim == 3:
Velocities_3D(n)
else:
print("error of dimension")
plt.show()
Velocities(1, 3)
Velocities(2, 2)
Velocities(3, 1)
__init__(dim=None, num=None, vx=None, vy=None, vz=None)¶Initialize self. See help(type(self)) for accurate signature.
Methods
|
Initialize self. |
|
return the symmetric velocity. |
|
create the symetric velocity. |
Attributes
velocity |


